2019HSCMultiple choice
Q8
1 mark
Question
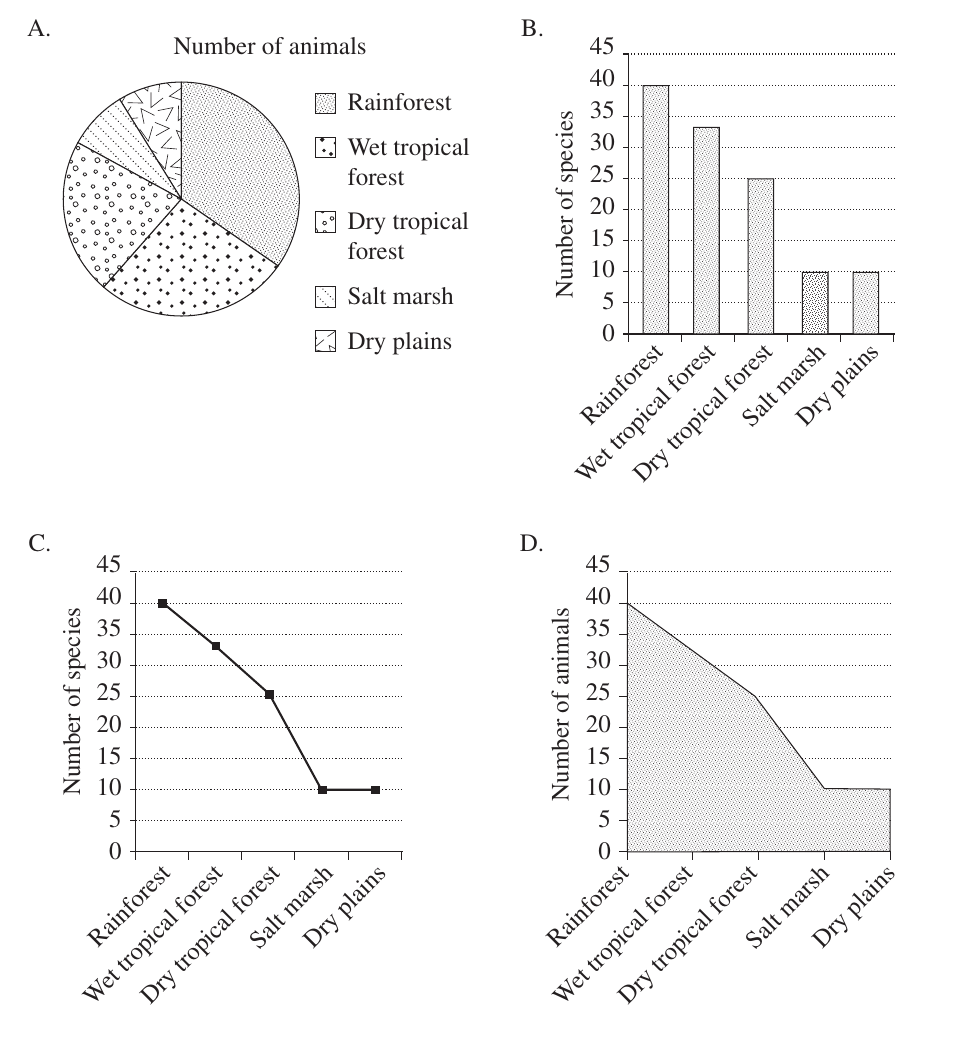
A group of four students set out to determine the animal species diversity over an area of one hectare in each of five different habitats. Each student graphed their data as shown.
Which of the graphs produced is the most suitable to represent animal species diversity in the different habitats?
Syllabus alignment
Module 5 · Heredity
- Genetic VariationAnalyse frequencies of population characteristics and single nucleotide polymorphisms.