2019HSCMultiple choice
Q16
1 mark
Question
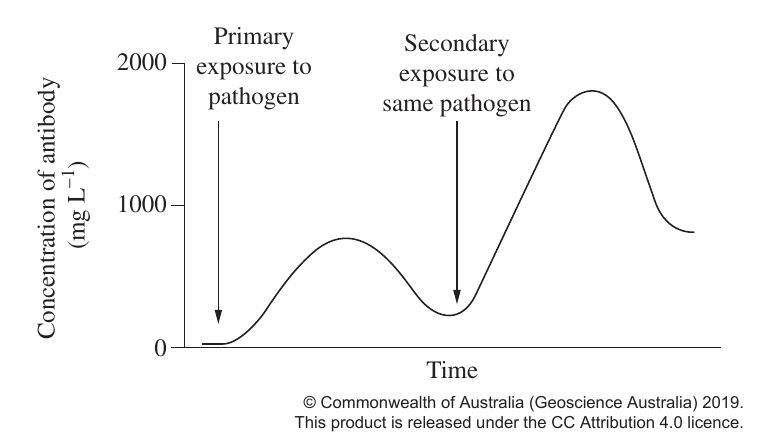
The diagram shows the concentration of an antibody to a particular pathogen. Primary Secondary 2000 exposure to exposure to Concentration of antibody pathogen same pathogen (mg L–1) 1000 0 Time © Commonwealth of Australia (Geoscience Australia) 2019. This product is released under the CC Attribution 4.0 licence. Two students are exposed to the pathogen. Student X had previously been vaccinated against this pathogen. Student Y had never been exposed to it. Which row of the table shows the most likely levels of antibody in the blood of each student a week after exposure to the pathogen on this occasion?
Concentration of antibody in the blood ()
| Student X | Student Y | |
|---|---|---|
| A. | 250 | 1500 |
| B. | 1500 | 1000 |
| C. | 1000 | 1500 |
| D. | 1500 | 250 |
Syllabus alignment
Module 7 · Infectious Disease
- ImmunityExplain innate and acquired immune responses after primary pathogen exposure.