2021TrialMultiple choice
Q8
1 mark
Question
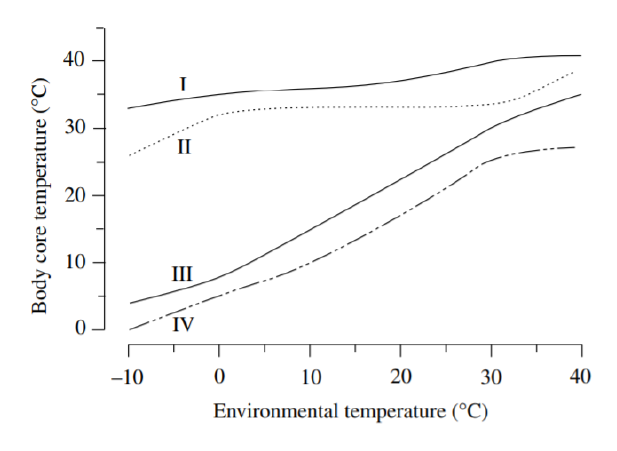
The graph below shows the relationship between body temperature and environmental temperature of 4 different organisms. Which of the following statements is best supported by the data?
A. Animals I and II are most likely mammals.
B. Animal II is endothermic over the environmental temperature range of 0 to 30°C.
C. Animal III maintains its body core temperature relatively constant by shivering when the environmental temperature falls below 37°C.
D. Animal IV is most likely a mammal in polar region.
Syllabus alignment
Module 8 · Non-infectious Disease and Disorders
- HomeostasisInvestigate behavioural, structural, physiological, hormonal, neural and plant water-balance mechanisms.